The Meridian Portal dashboards give you valuable insights to your projects, packages, and documents in one place. With them, you can view a variety of metrics and filter the results by project names and dates. If desired, you can export the data in spreadsheet formats for further analysis.
Dashboards are available from the Meridian Portal landing page (all projects for Tenant Administrators only) and for each project (Project Owners, Document Controllers, and Contractors).
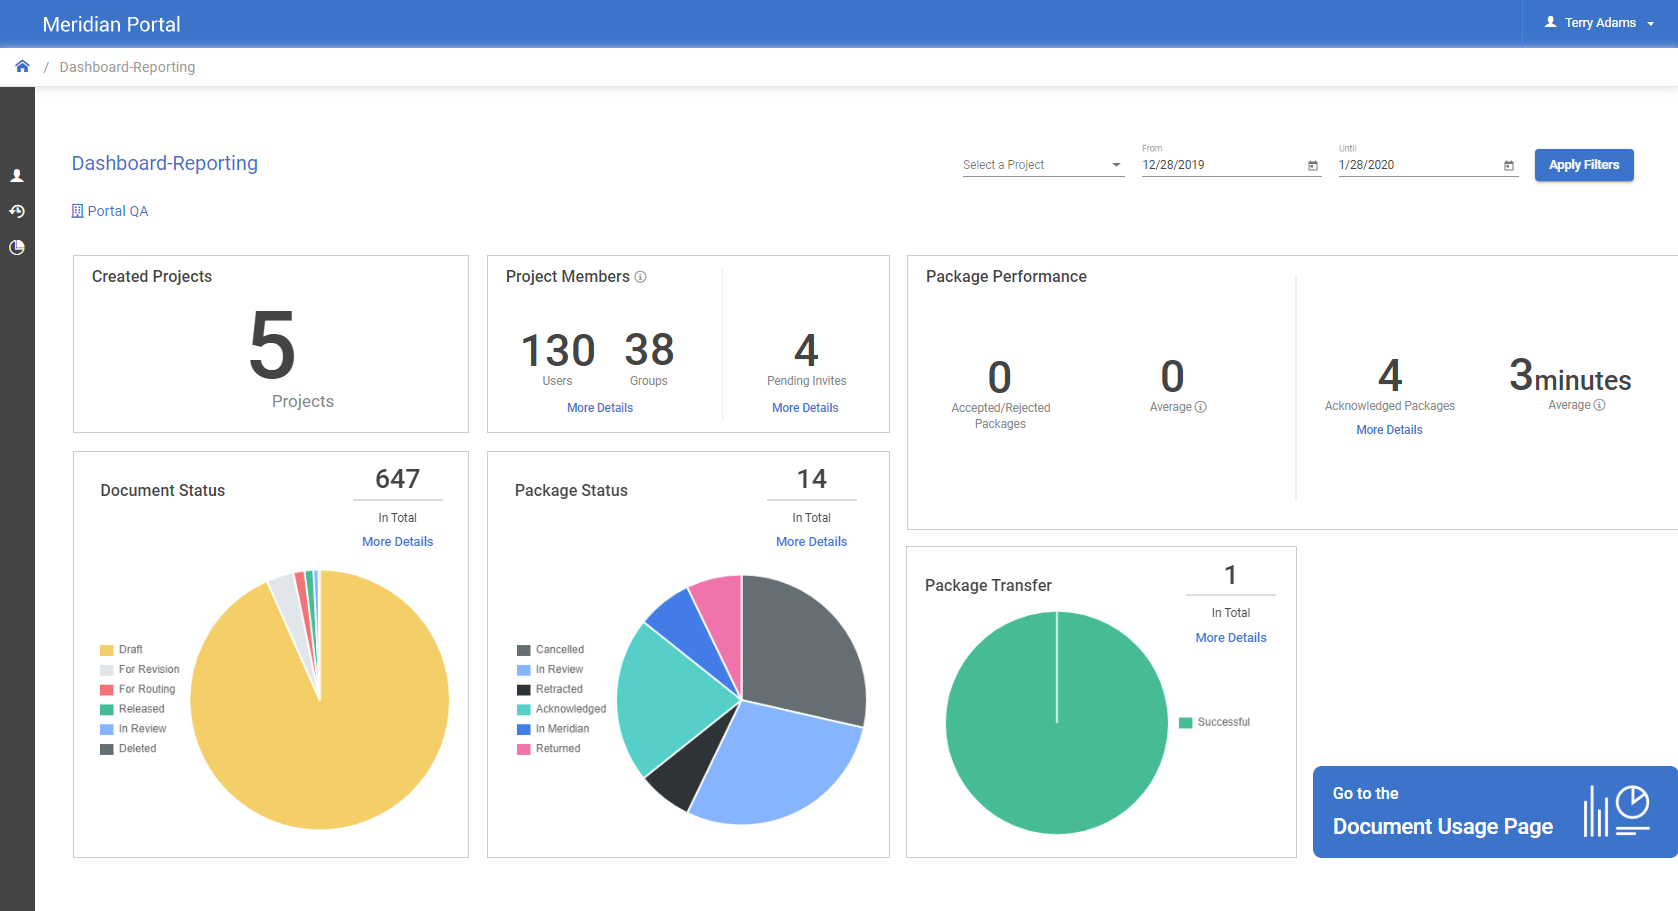
Depending on your role, it shows multiple widgets that report metrics for the selected projects and time period, including:
-
Created Projects — quantity of projects in the tenancy. Available only at the tenancy level.
-
Project Members — quantities of users, groups, and pending invitations (on the date shown for the Until filter criterion). On the Pending Invites details page, you can specify an email address filter criterion.
-
Package Performance — quantity of accepted or rejected package and the average time elapsed from their acknowledgment to their acceptance or rejection. Also the quantity of acknowledged packages and the average time elapsed between when they were submitted and when they were acknowledged.
-
Document Status — quantity of documents and their workflow status.
-
Package Status — quantity of packages and their workflow status.
-
Package Transfer — quantity of packages transferred from Meridian Enterprise to Meridian Portal and their transfer status.
-
Review — quantity of packages in the In Review workflow state.
-
Approval — quantity of packages in the For Approval workflow state.
The widgets that are available to you depend on your role in the selected projects. Some widgets allow you to download the base data in a spreadsheet format for further analysis.
 .
. 
 and then select the reporting period start date.