Inspect a Background Task
You can learn a lot about a background task by viewing closely the information that Meridian Enterprise Server provides about it:
-
Status, progress, and details
-
Performance effects on the server
-
Errors
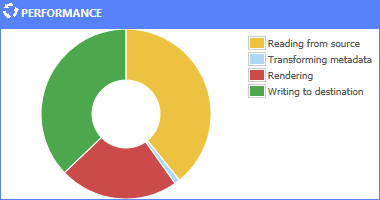
The performance data is shown as a pie chart similar to the following figure. The chart divides the total elapsed time to run the publishing job into its individual processes. This chart can be useful to identify bottlenecks in Meridian Enterprise Server performance.
To inspect a background task:
-
Open the Tasks page as described in Monitor Background Tasks.
-
Select the task that you want to inspect and then in the toolbar, click Open.
The Dashboard page for the task appears and shows an overview of the task and performance statistics related to the task. To show performance data for the task as a pie chart in the Performance pane, enable the Collect dashboard statistics option of each task for which you want to see the dashboard as described in Configure Synchronization Options. If you do not have the required licenses, you will not have access to these configuration options.
Note:
The statistics for synchronization jobs that use batch synchronization will not appear until after each batch has completed.
-
To view any errors that occurred during the task:
-
In the menu, click Diagnostics.
The errors are listed in the order that they occurred.
-
To view only the failed processes:
-
Click the process result (Passed or Failed) and in the menu that appears, click Failed.
The processes that succeeded are hidden.
The details of failed tasks can be exported for troubleshooting.
To export the task details:
-
Click Export.
The file LogTaskDetailsExport.xlsx is downloaded by your browser and you are prompted for what to do with it.
-
Save or open the file.